Global, Regional, and National Trends
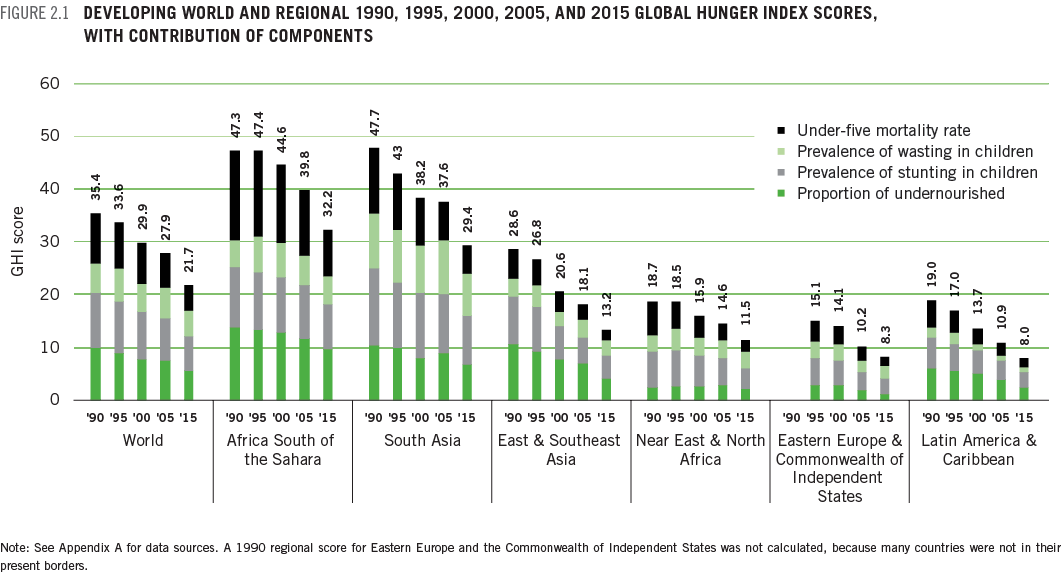
Since 2000, significant progress has been made in the fight against hunger.1 The 2000 Global Hunger Index (GHI) score was 29.9 for the developing world, while the 2015 GHI score stands at 21.7, representing a reduction of 27 percent (Figure 2.1).2 To put this in context, the higher the GHI score, the higher the level of hunger. Scores between 20.0 and 34.9 points are considered serious.
Thus while the GHI scores for the developing world—also referred to as the global GHI scores—for 2000 and 2015 are both in the serious category, the earlier score was closer to being categorized as alarming, while the later score is closer to the moderate category. As described in Chapter 1, all GHI calculations in this report, including those for the reference years 1990, 1995, 2000, and 2005, have been calculated using a revised formula. The severity scale was adjusted to reflect this change.

Large Regional Differences
The global averages mask dramatic differences among regions and countries. Africa south of the Sahara and South Asia have the highest 2015 GHI scores, at 32.2 and 29.4 respectively. Both reflect serious levels of hunger. In contrast, the GHI scores for East and Southeast Asia, Near East and North Africa, Latin America and the Caribbean, and Eastern Europe and the Commonwealth of Independent States range between 8.0 and 13.2, and represent low or moderate levels of hunger.
Africa south of the Sahara has the highest 2015 GHI score, at 32.2. Overall, since 2000, the region has experienced strong economic growth (UNCTAD 2014). It has also benefitted from advances in public health, including lower transmission levels and better treatment of HIV/AIDS, and fewer cases and deaths from malaria (AVERT 2014; WHO 2013).
Best and Worst Country-Level Results
From the 2000 GHI to the 2015 GHI, 17 countries made remarkable progress, reducing their GHI scores by 50 percent or more. Sixty-eight countries made considerable progress with scores that dropped by between 25.0 percent and 49.9 percent, and 28 countries decreased their GHI scores by less than 25 percent. Despite this progress, 52 countries still suffer from serious or alarming levels of hunger.
Of the countries that achieved the 10 biggest percentage reductions in GHI scores from the 2000 GHI to the 2015 GHI, three are in South America (Brazil, Peru, and Venezuela), one is in Asia (Mongolia), four are former Soviet republics (Azerbaijan, Kyrgyz Republic, Latvia, and Ukraine), and two are former Yugoslav republics (Bosnia and Herzegovina plus Croatia). The GHI scores for each of these countries have declined significantly—between 53 and 71 percent since the 2000 GHI.
- Brazil reduced its 2000 GHI score by roughly two-thirds.
- Peru made impressive progress by cutting its 2000 GHI score by 56 percent.
- Mongolia also saw a 56 percent drop between its 2000 and 2015 GHI scores.
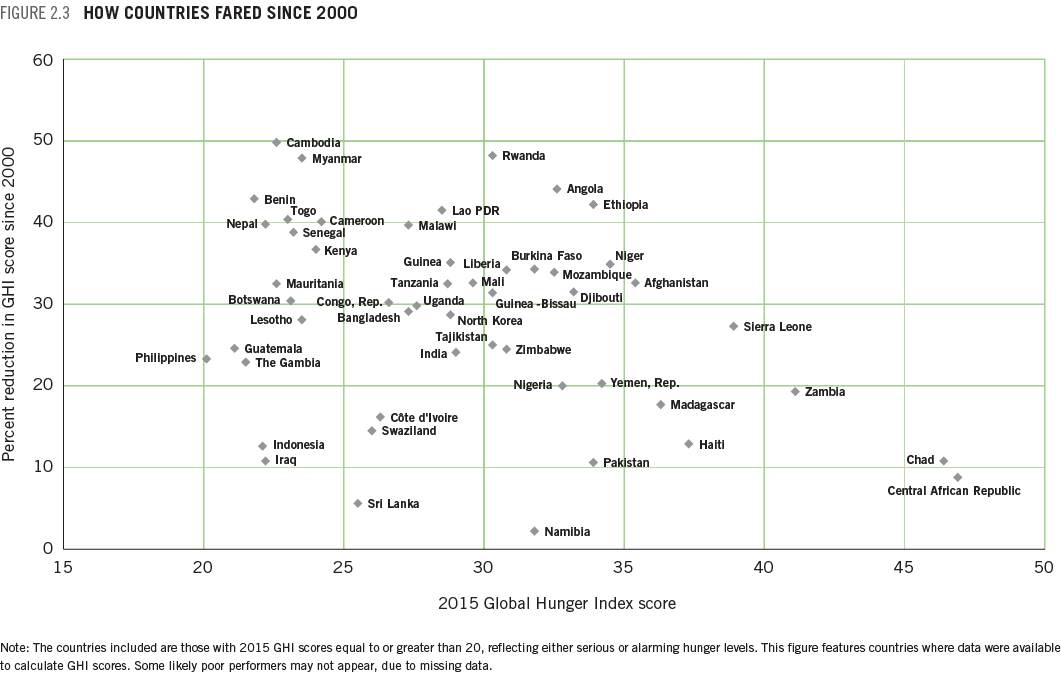
Since 2000, Rwanda, Angola, and Ethiopia have seen the biggest reductions in hunger, with GHI scores down by between 25 and 28 points in each country. Despite these improvements, the hunger levels in these countries are still serious.

Eight countries still suffer from levels of hunger that are alarming. The majority of those are in Africa south of the Sahara. The three exceptions are Afghanistan, Haiti, and Timor-Leste.
The Central African Republic, Chad, and Zambia have the highest 2015 GHI scores. Coupled with low percentage reductions in hunger levels since 2000, these countries merit our attention (Figure 2.3).
This year’s report does not include GHI scores for several countries that had very high (alarming or extremely alarming) GHI scores in the 2014 report, including Burundi, Comoros, Eritrea, South Sudan, and Sudan, because current data on undernourishment were not available.3 In addition, while the Democratic Republic of the Congo had the highest GHI score of all countries in the 2011 GHI report, it has not been possible to calculate a GHI score for the country since 2011 due to missing data. GHI scores have never been calculated for Somalia due to data constraints, yet the World Food Programme considers it one of the most food insecure countries in the world (WFP 2015b). Although the lack of data obscures their hunger levels, the situations in these countries still merit great concern and must not be forgotten.
-
While the analysis in previous GHI reports focused on comparisons with hunger levels in 1990, the analysis in this year’s report centers on comparisons with hunger levels in 2000. Many countries experienced fluctuations between 1990 and 2015, and making comparisons with 2000 captures more recent trends. ↩
-
The regional and global aggregates for each component indicator are calculated as population-weighted averages, using the indicator values reported in Appendix B. Provisional estimates for undernourishment for Burundi, Comoros, the Democratic Republic of the Congo, Eritrea, Libya, Papua New Guinea, Somalia, and Syria were used in the calculation of the global and regional aggregates only, but are not reported in Appendix B. These estimates are based on previously published undernourishment data and provisional estimates provided by FAO in 2014 for the sake of regional and global aggregation only. The regional and global GHI scores are calculated using the regional and global aggregates for each indicator and the revised formula described in Chapter 1. ↩
-
In the 2014 GHI, scores for South Sudan and Sudan were calculated together as the former Sudan. In the 2015 GHI, Sudan and South Sudan are reported separately because all organizations that provide data on the component indicators now report them as separate countries. ↩


